
St. James’s Place (STJ) – A Classic Wyckoff Spring Setup
- May 20
- 3 min read
There are certain patterns that repeatedly show up across markets and timeframes. One of our favourites at FoundryStrat is the Wyckoff Spring. It's a false breakdown that traps sellers right before price reclaims the range and starts moving higher again.
STJ has recently presented a setup that fits many of the characteristics we look for.
What We’re Seeing
Price had been under heavy pressure for months, with a clear downtrend in place. Recently though, STJ pushed beneath a well-defined prior low around the 1140p area. On the surface, it looked like another breakdown continuation.
But then came the important part.
Instead of accelerating lower, buyers stepped in aggressively and price quickly reclaimed the prior range. That reclaim is what we love to see. In Wyckoff terms, the market “springs” the lows. It shaking out weak holders and trapping breakout sellers before reversing back upward.

The setup becomes even more interesting because:
The move below support was brief - we like just one or two canldes only
Buyers defended the move quickly
Price could start reclaiming short-term moving averages quickly
Risk can be defined tightly beneath the spring low
The upside target offers asymmetric reward versus the downside risk
Why We Like Springs
The beauty of the Wyckoff Spring is that it creates emotional exhaustion right at the lows.
Most participants see:
A breakdown
Negative momentum
Fear increasing
Confirmation of the downtrend
But the market often moves in the opposite direction once everyone leans the same way. There are no more sellers to keep pushing the market low. Bigger instiutions start to see value and support the price. The failed breakdown becomes fuel for the reversal.
That’s why these setups can move sharply once price starts reclaiming the range. Short sellers get trapped while big buyers suddenly chase back in looking for good value.
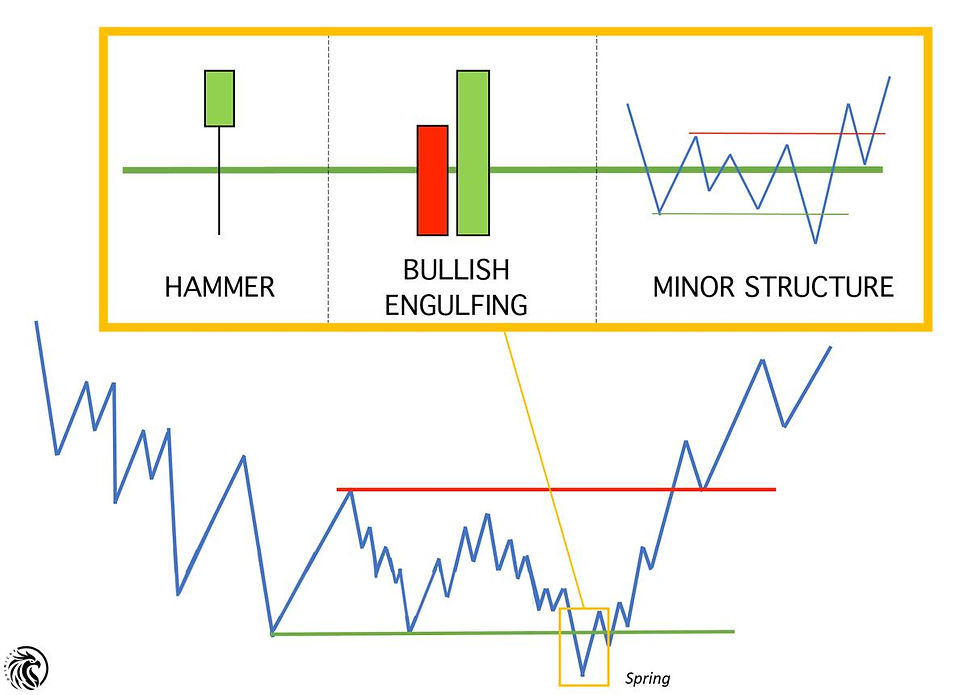
Supported by the Price Action
Another indicator of strength here is the candle setup. We like to see a Bullish Engulfing candle - you can see the green candle fully encloses the prior red down canlde. That's another reversal sign and could add more strength to the arguement.
Often you'll see Hammer candles at these lows, that can work well. But Bullish Engulfing is a great sign. You're now comhing market structure, price action and pattern recognistion with risk management. Springs are likely going to work better when the wider market is moving up and that's also in our favour as markets are strong currently. You don't really want to be doing this in negatively trending markets.
Trade Structure
The way we typically approach these setups is simple:
Entry
We want to see price reclaim the range after the false break lower within one or two candles max. Once the price breaks back in, your job is to buy the break of the candle (including the wick). You can set an order to buy at the high of the candle - or set an alert and buy at market.
Stop
Risk sits beneath the spring low. If price loses that level again decisively, the setup is invalidated and you're out of the trade.
Targets
Initial upside targets often become:
Prior resistance zones, perhaps 1330p or all the way back up to 1550p area.
Look at any range highs - at these points, we'd look to lock in some profit - 1/3 or 1/2.
You can then use major moving averages to trail your stop looking to stay in the trade and ride a trend
In this case, the risk/reward profile is what makes the setup attractive. Defined downside with significantly larger upside potential if momentum starts to build.
The Bigger Picture
One thing worth remembering is that springs work best when:
Sentiment has become overly bearish
The move lower looks “obvious”
Volatility shakes out weak holders
The market is positioned one way
STJ isn’t confirmed into a major new uptrend yet. This is still an early-stage reversal attempt. But structurally, this is exactly the type of price action we monitor closely.
Sometimes the best trades begin when the chart still looks ugly.
That’s the point.
We’ll check back in and update the post once the trade is completed.
Comments