
Spring 4 Hour - The False-Breakout Trap Strategy
- Feb 18
- 4 min read
Updated: Apr 25

2025 4H Backtest Results & Implementation Guide
Markets in 2025 were reasonably volatile, with liquidity sweeps and sudden false moves creating opportunities.
FoundryStrat's False-Breakout Trap Strategy exploits price rejections, turning apparent breakouts into structured trading opportunities.
This post covers:
The strategy framework
2025 4H backtest results (228 trades across a few core FX pairs like GBPJPY, USDJPY, EURUSD, GBPUSD)
Risk and trade management
How traders can implement it
Why backtesting is critical
Structural edge & key considerations
1️⃣ Strategy Concept
The strategy is designed to fade false breakouts: the opposite of chasing trend moves. It relies on price rejection wicks and market overextension.
Core idea:
Price attempts a breakout beyond a recent high or low - we like to use tops/bottom of wicks because its extremes of where price was rejected.
The breakout fails to hold and traders are “trapped.”
We enter in the opposite direction once the failure is confirmed.
This exploits predictable behavioural patterns:
Retail traders chasing breakouts
Stop clusters beyond obvious highs/lows
Liquidity-seeking - institutions drive price to an area to create liquidity
2️⃣ How It Works in Practice
Step 1: Identify Rejection Areas
Look for long (ideally) upper or lower wicks indicating rejection.
Focus on recent highs/lows or session extremes.
These are high-probability areas for false-breakout traps.
Step 2: Wait for the Fake Break
Wait for a candle to break the wick, creating the appearance of a breakout.
Do not enter yet, this is the trigger.
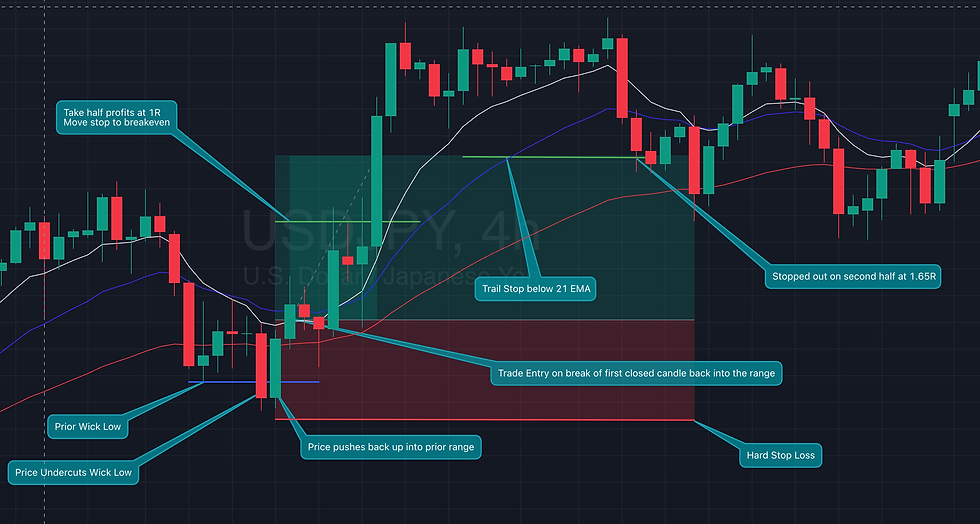
Step 3: Confirm the Reversal
Watch the next one or two candles. If price hasn't broken back within 2 candles, the trade is not valid.
Enter if one of these closes back into the range ie. in the opposite direction of the failed break.
Entry is after confirmation, not anticipation. The trade can be placed as an order, just above/below the confirmation candle.
Step 4: Stop & Risk
Stop is placed beyond the wick high/low that triggered the fake breakout.
Risk: 0.5–1% per trade of current account balance.
Step 5: Target & Management
At 1R, take half and trail the rest behind the 21 EMA.
Many trades end at scratch on the second half (0R).
Occasional strong runners 2–9R are the key drivers of P/L.
Letting winners run helps the edge unlock positive expectancy
3️⃣ 2025 4H Backtest Results (228 Trades)
Metric | Value |
Trades | 228 |
Wins | 144 |
Losses | 84 |
Win rate | 63.2% |
Average win | +1.59R |
Average loss | -1R |
Expectancy | +0.69R per trade |
Total R | +157R |
Highlights:
Many small scratch trades
Controlled losses: all strictly at -1R
Positive skew with large outliers (5R–9R)
4️⃣ Why It Works
This strategy exploits behavioural traps and structural liquidity mechanics:
Retail breakout chasing: Traders get trapped above/below obvious levels.
Liquidity sweep: Price briefly breaches the wick area to trigger stops.
Rejection & mean reversion: Price reverses into the range; the edge is in fading the breakout.
The strategy does not predict the market, it reacts to structural price behaviour.
5️⃣ Why Backtesting Matters
Backtesting is the backbone of systematic trading. Before risking real capital, it allows you to:
Validate the Edge – Check if false-breakout traps historically produce positive expectancy.
Understand Risk & Drawdown – See losing streaks and worst-case scenarios; size risk appropriately.
Refine Trade Rules – Identify which wick patterns and timeframes perform best.
Build Confidence & Discipline – Learn that drawdowns are normal, helping you stick to the plan.
Project Compounded Returns – Model account growth realistically using R-multiples and fractional risk.
In short: backtesting transforms a good idea into a repeatable, scalable strategy.
6️⃣ Implementation Checklist
1. Chart Setup: 4H
Mark previous highs/lows and obvious wicks
2. Watch for Breaks:
Candle breaks wick and the potential trap is set
3. Confirm Reversal:
Next 1–2 candle closes back into range or opposite direction = enter on the break
4. Stops & Risk:
Place beyond the low of first candle
Risk 0.5–1% per trade
5. Trade Management:
Partial exits optional at 1R
Let runners extend
Trail stops by structure
7️⃣ Risk Management
Fixed fractional risk works best: 0.5–1% per trade
Historical drawdowns: ~6R → ~3–3.5% at 0.5% risk
Avoid increasing size after wins or chasing trades
Discipline and patience are key
8️⃣ Market Suitability
Major FX pairs (eg. EURUSD, GBPUSD, USDJPY)
Indices (eg. NAS100, SPX, DAX)
Gold and possibly Silver (but we're yet to backtest.
It also works on many timeframes because of the fractal nature of the markets - we've discussed this in other blogs around Day Trading.
Less effective in illiquid or low-volatility environments
9️⃣ Conclusion
The False-Breakout Trap Strategy is a mean-reversion, counter-trend method that thrives in high-liquidity, volatile environments.
Edge: exploiting false breakout wicks and liquidity traps
Risk profile: controlled with small fixed fractional risk
Outcome: many scratch trades, occasional high R winners, strong positive expectancy
The key is discipline, patience, and letting winners run — not predicting the market.
🔟 Results: Compounded 0.5% Risk Example
Starting Balance: £10,0001R = 0.5% risk per trade
Total R: +157R
Compounded account growth ≈ £18,900
Total return ≈ +89%
Comments